Investment strategies in the current economic environment: a challenge for investors with the help of ChatGPT (OpenAI)
Let's see how AI (Artificial Intelligence), in particular the famous ChatGPT by OpenAI, constructs a diversified investment portfolio across asset classes in a context such as the current one (2023) with high inflation and high interest rates. We compare using the Wallible platform the portfolio created by the AI with two benchmarks: Ray Dalio's famous All Weather and the MSCI World
Saturday, 22 April 2023

Intro & Investment Specifications
We presented ChatGPT with an interesting challenge: to create an investment portfolio for a European retail investor who wants to start a capital accumulation plan that guarantees a return in the medium to long term (>=10 years) and a medium to high risk tolerance (can bear losses over the investment horizon). You are asked to suggest an investment strategy for 2023, considering an economic environment characterised by rising interest rates, the bankruptcy of some banks and global inflation around 10% per annum, paying attention to transaction costs, which may reduce net gains in the long term.
AI-based portfolio allocation
To create an investment strategy that meets investor specifications, ChatGPT proposed a portfolio allocation based on five asset classes: equities, bonds, real estate funds, precious metals and cryptocurrencies. The drivers of choice and the proposed allocation for each asset class are described below.
Equities: 40% of the portfolio
Ticker: CSPX Name: iShares Core S&P 500 UCITS ETF Rationale: This ETF offers exposure to the S&P 500 Index, which represents the US stock market and offers broad and deep diversification. Equity investments can offer high long-term return potential and inflation protection. This ETF also has a low management cost of 0.07%.
Bonds: 30% of the portfolio
Ticker: AGGU Name: iShares Global Aggregate Bond UCITS ETF Rationale: This ETF offers exposure to a broad universe of highly rated, high-quality global bonds, including government, corporate and mortgage bonds. Bonds can offer a steady income stream and portfolio diversification. This ETF also has a low management cost of 0.10 per cent.
Real estate funds: 10% of the portfolio
Ticker: IWDP Name: iShares Developed Markets Property Yield UCITS ETF Rationale: This ETF provides exposure to developed property markets and offers a steady income stream through dividend payments. Real estate is traditionally less volatile than the stock market and can offer an effective diversification opportunity. This ETF also has a low management cost of 0.59%.
Precious metals: 10% of the portfolio
Ticker: SGBS Name: WisdomTree Physical Swiss Gold UCITS ETF Rationale: This ETF offers exposure to physical gold, which is traditionally viewed as insurance against inflation and market uncertainties. Gold can offer an opportunity for effective diversification and portfolio protection in times of market uncertainty and volatility. This ETF also has a low management cost of 0.15 per cent.
Cryptocurrencies: 10% of portfolio
Ticker: BTC Name: Bitcoin Rationale: Bitcoin is the largest and most popular cryptocurrency. Cryptocurrencies offer high long-term return potential, but are also highly volatile and therefore require a higher risk tolerance. his portfolio allocation provides effective diversification across five different asset classes, offering long-term high return potential and protection against inflation and market uncertainties. In addition, using UCITS ETFs reduces management costs and provides exposure to a broad universe of assets, ensuring effective diversification.
Portfolio results constructed by ChatGPT and comparison with two benchmarks: MSCI World equity accumulation ETF and All Weather

The suggested investment strategy was added on our Wallible platform and the results were compared with two other strategies: iShares MSCI World and PAC All Weather.
| strategy | profit/loss | annualised returns | annualised volatility | sharpe ratio | max drawdown |
|---|---|---|---|---|---|
| PAC Chat GPT | 77.31% | 12.31% | 12.68% | 0.971 | -22.50% |
| iShares MSCI World | 61.12% | 11.16% | 17.71% | 0.63 | -33.57% |
| PAC All Weather | 35.10% | 6.34% | 9.76% | 0.65 | -14.67% |
The results comparison table shows that the PAC Chat GPT investment strategy recorded a profit of 77.31%, with annualised returns of 12.31% and annualised volatility of 12.68%, with a Sharpe Ratio of 0.971 and a maximum drawdown of 22.50%. The iShares MSCI World returned 61.12%, with annualised returns of 11.16% and annualised volatility of 17.71%, with a Sharpe Ratio of 0.63 and a maximum drawdown of 33.57%. The All Weather PAC strategy recorded a 35.10% profit, with annualised returns of 6.34% and annualised volatility of 9.76%, with a Sharpe Ratio of 0.65 and a maximum drawdown of 14.67%.
It can be seen immediately how the proposed portfolio returned more than the others with lower volatility than an all-equity portfolio, but higher than the All Weather
PAC Chat GPT performances
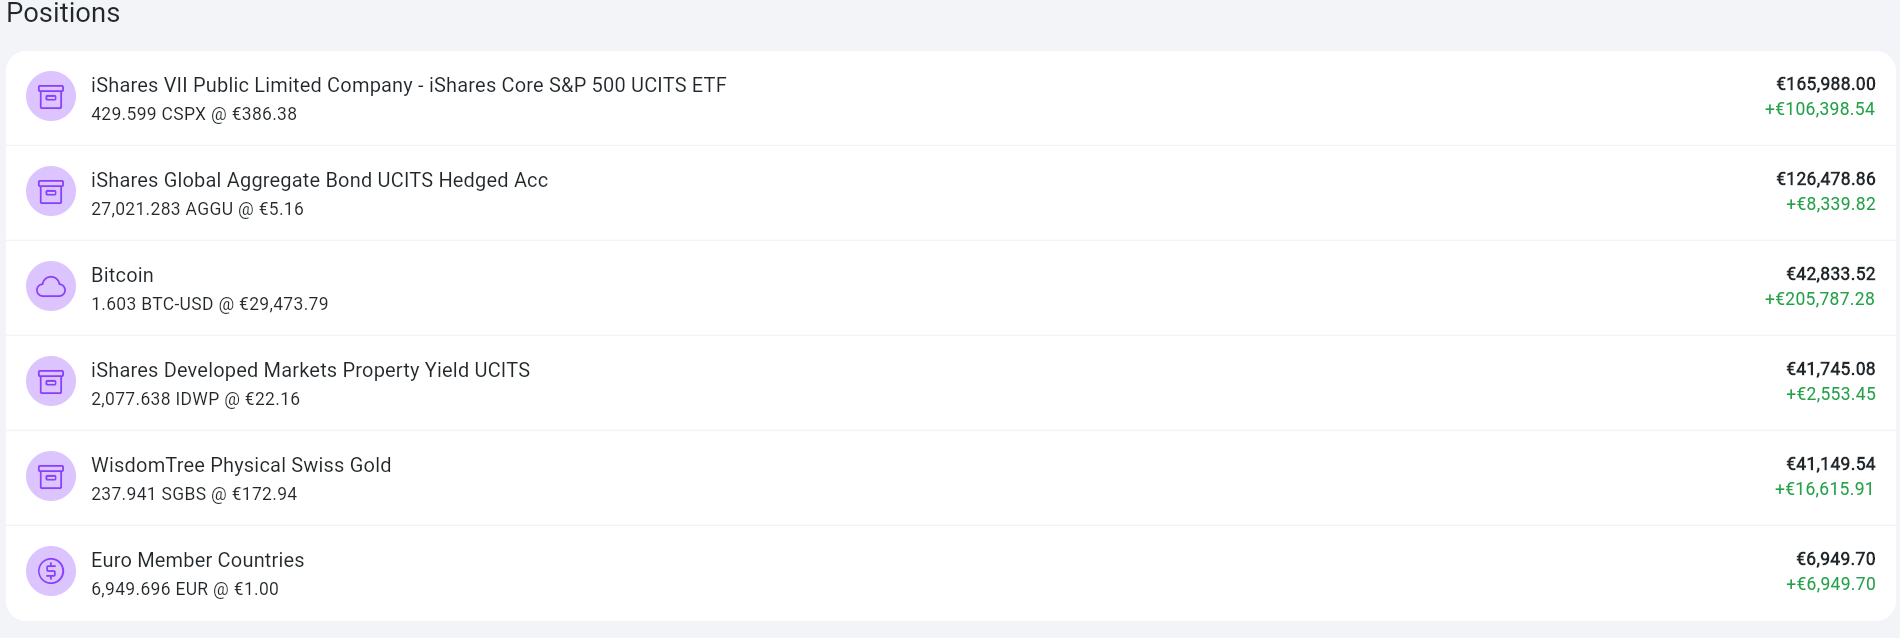
A comparison with two different benchmarks was shown. Let us now see how a €500 per month PAC, rebalanced monthly, would have performed from 2010 to the present. In the next pictures we see the trend over time of the value invested and the value accrued by the PAC, followed by the benchmark metrics, which characterise its risk and total profit. In addition, the current capital gain/loss is shown for each position in the portfolio. Note that the liquidity present is only due to the dividends earned through the real estate ETF, which are not reinvested in this example.


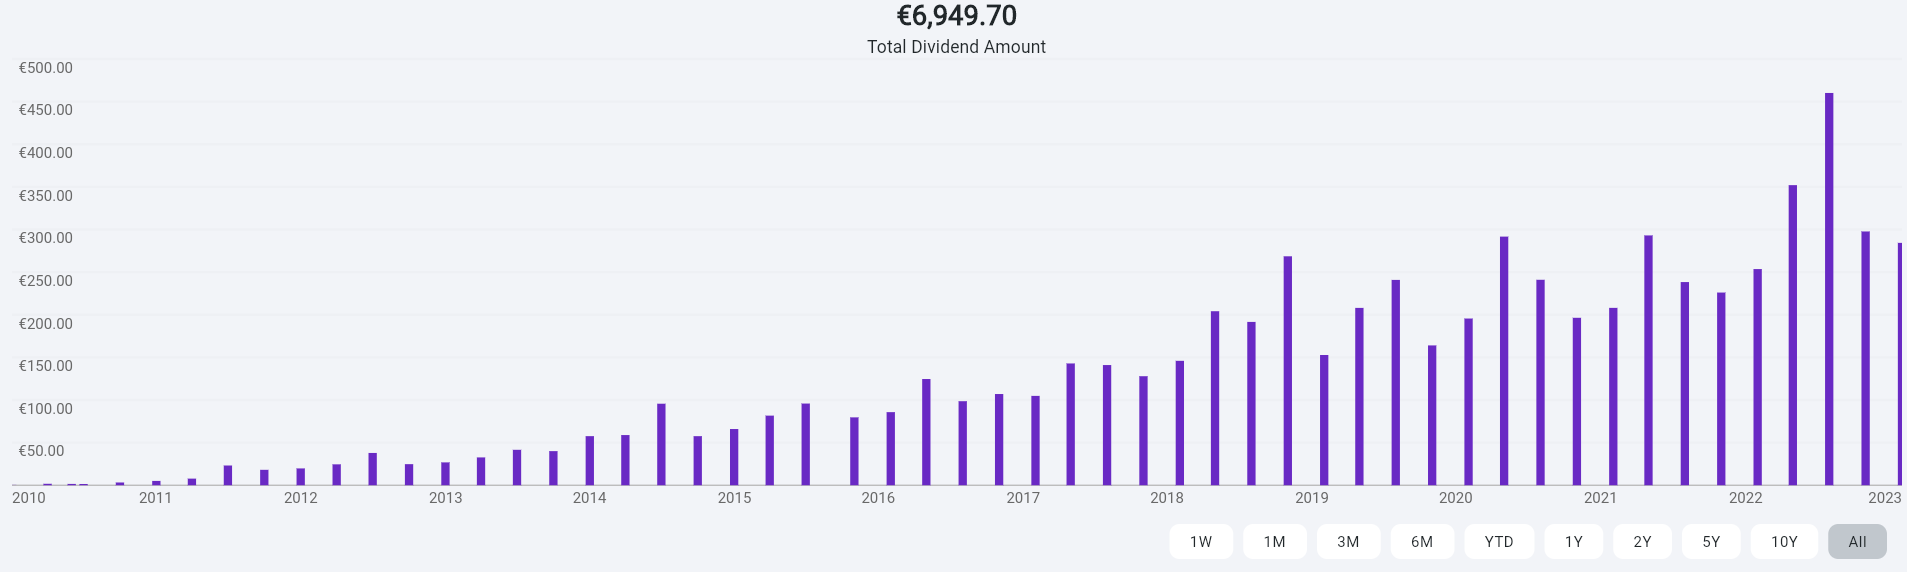
Speaking of dividends, below are the coupons taken over time for the Developed Market Property ETF.
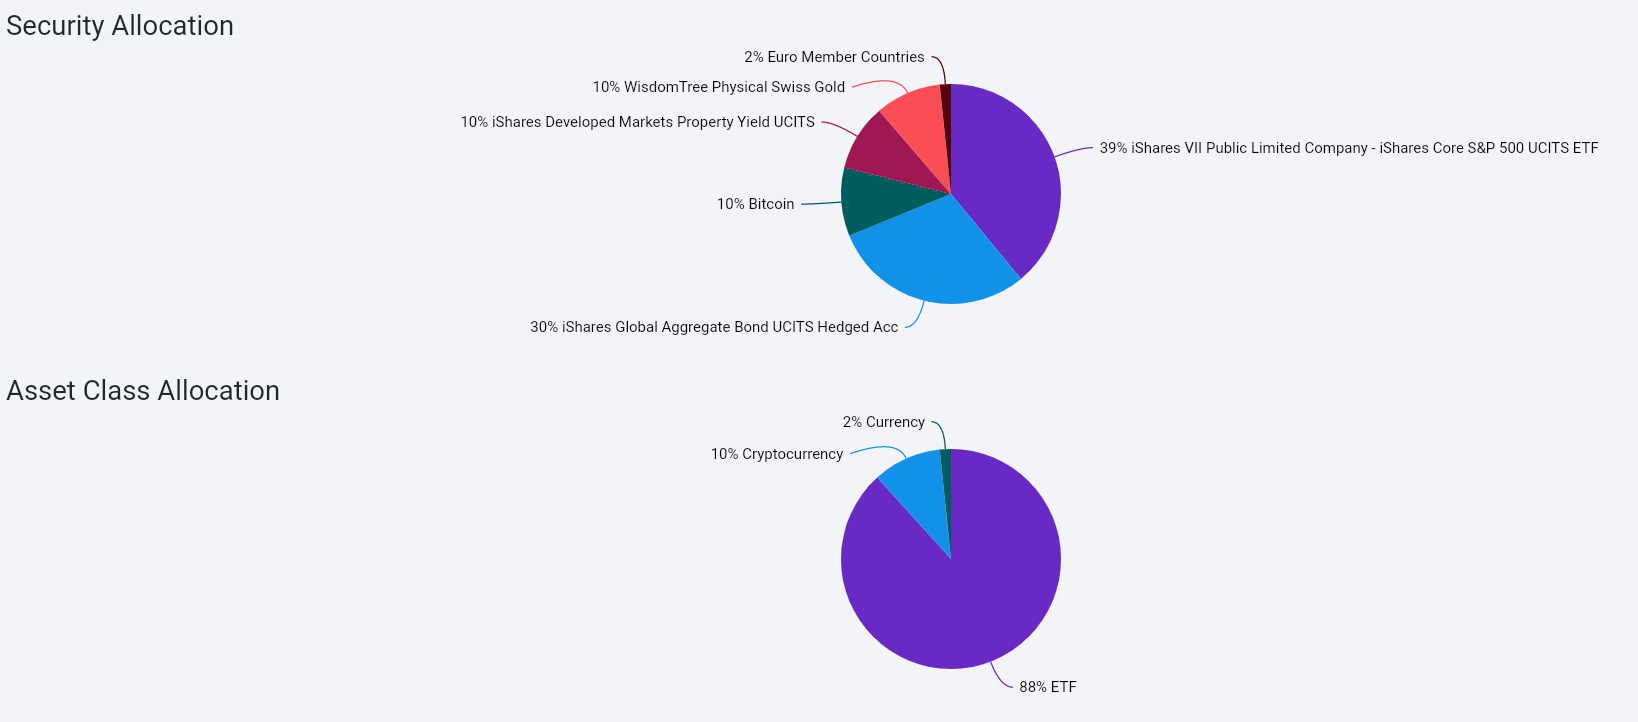
Finally, we look at the final allocations of the individual securities in the portfolio and also how the allocations are distributed for each asset class in our investment.
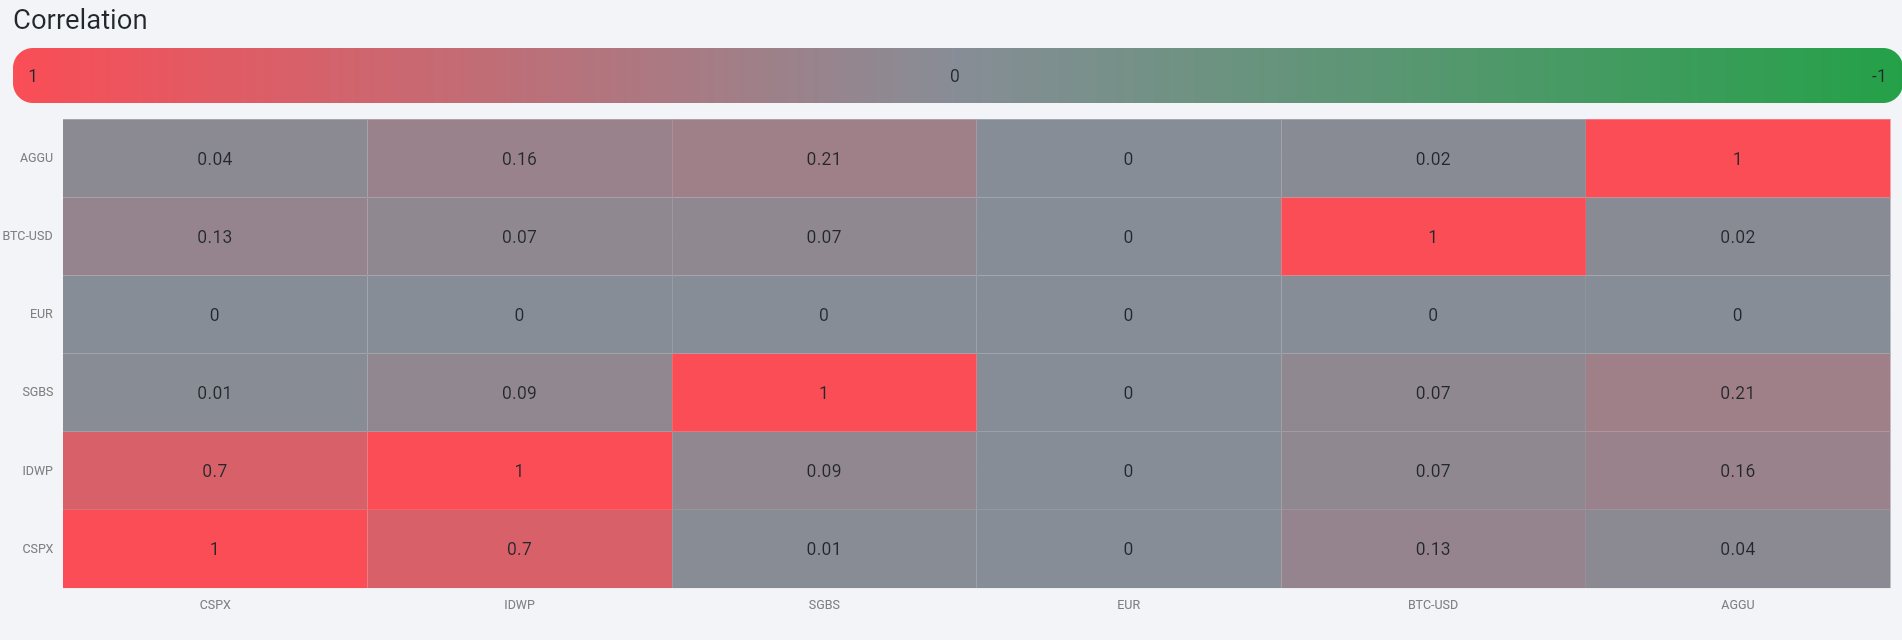
How diversified is our investment portfolio? We find out with the following correlation matrix: a value close to 0 indicates that the two securities are uncorrelated with each other (trends do not necessarily move in the same direction), while a value close to 1 that they are correlated with each other (trends move in the same direction) and a negative value close to -1 indicates an inverse correlation (trends move in the opposite direction).
Conclusion
In conclusion, the PAC Chat GPT investment strategy proved to be the best option, with a high return and moderate risk. However, it is important to remember that past performance does not guarantee future results and that every investment carries a risk.
In the future, we will cover other investment demands and how AI-based portfolio allocation and optimisation can be used for these demands. Investors should carefully consider their risk tolerance and consult a financial advisor before making investment decisions.
Related guides
Accumulating vs Distributing ETFs: Which Should You Choose?
Accumulating or distributing ETF? The choice affects tax timing and long-term compounding. How to decide based on your …
The 4% Rule: How Much Can You Safely Withdraw in Retirement Each Year
The 4% rule defines the annual withdrawal rate that lets a portfolio last 30 years. How it works, why Europeans need a …
Lazy Portfolio: How to Build a Low-Cost ETF Portfolio That Beats Most Active Funds
A lazy portfolio outperforms 90% of active funds with two ETFs and one hour per year. Complete guide to the best models …