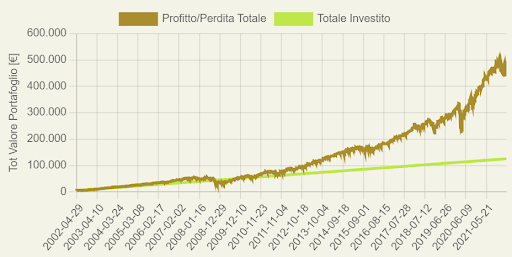
DCA (Dollar Cost Averaging) on S&P 500 over the past 20 years
Dollar Cost Averaging (DCA) is a popular investment strategy that involves investing a fixed amount of money at regular intervals, regardless of the market conditions. In this article, we will explore how DCA would have performed on the S&P 500 over the past 20 years. The S&P 500 is widely regarded as a benchmark index for the US stock market and represents the performance of 500 large-cap US companies. By analyzing the performance of DCA on the S&P 500 over the past two decades, we aim to provide insights into the effectiveness of this investment strategy for long-term investors.
Wednesday, 27 April 2022

How much would a PAC on the S&P 500 have returned over the past 20 years?
Let’s look today at a Capital Accumulation Plan on an all US equity portfolio, specifically on the S&P500 index. To simulate this investment plan with Wallible instruments we make the following choices:
- initial investment of €5,000
- periodic monthly investment of €500
We see that over the long term the high risk, quantifiable with a volatility of 19.7% of the portfolio, has returned a considerable profit of around 250% (11.5% annualised). Thus, against an accumulated investment of 125k€, the current value stands at about half a million. Over the long term, the beneficial effect of compound interest can also be seen, the right-hand side of the graph showing an exponential departure of the portfolio value curve (brown) and invested capital (green). We also note how the maximum drawdown during the sub-prime crisis is -46%.


Discover how easy it is to replicate this analysis and many other investment strategies in the Wallible app. With free registration you get access to all the tools.
Sign up for freeThe importance of the PAC, in addition to allowing investment with small capital, which is accumulated over time, is that of mediating the purchase price by buying shares every predetermined period (in the example seen: monthly).
Disclaimer
This article is not financial advice but an example based on studies, research and analysis conducted by our team.