
How have the 5 most capitalised companies in the FTSE MIB performed over the last 10 years?
Let’s see by trying to simulate a PAC with 10000€ initial investment and 300€ recurring each month on the following companies:
- Enel: 20%
- Stellantis: 20%
- ENI: 20%
- Intesa Sanpaolo: 20%
- Ferrari: 20%
Recurring investment simulation over the last 10 years –> PAC simulator
From the following graphs, we can immediately see that the value of the portfolio has more than doubled compared to the investment, with a final present value of the simulation of around €120000. The high volatility and maximum drawdown during the Covid19 period highlight the criticality of an entirely equity portfolio that is geographically and sectorally not well diversified.

| Total Amount Invested | Final Portfolio Value | Profit | Volatility | Annualised Return | Maximum Drawdown |
|---|---|---|---|---|---|
| 46000€ | 119101.36€ | 158.92% | 24.1% | 18.8% | -37.43% in data 2020-03-12 |
Discover how easy it is to replicate this analysis and many other investment strategies in the Wallible app. With free registration you get access to all the tools.
Sign up for freeBut who performed better among the 5? –> Comparator
From the performance, we see that Ferrari has achieved around 350% in just 6 years since it was listed, and the other performances in the table follow.
| Asset performance (10 years) | |
|---|---|
| Ferrari | 353.57% |
| Stellantis | 202.34% |
| Enel | 118.53% |
| ENI | 47% |
| Intesa Sanpaolo | 23.46% |
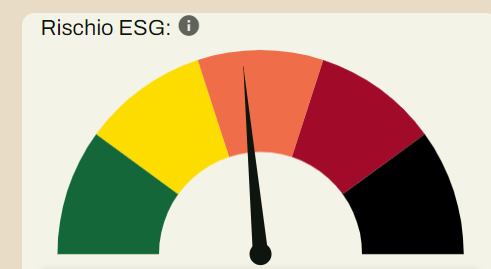
And how is such a portfolio positioned in terms of ESG?
The speedometer shows an intermediate ESG risk for this portfolio… without infamy or praise!
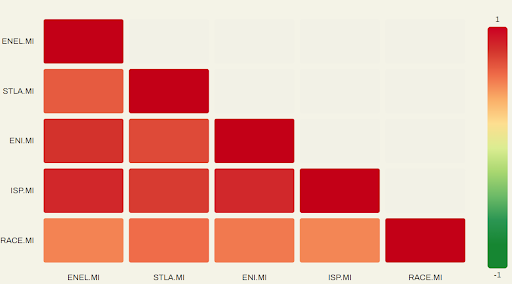
Securities correlation matrix –> Correlator
As was to be expected, the securities are all positively correlated. The correlation matrix shows the pair with maximum and minimum correlation: Max → ENEL - Intesa Sanpaolo: 0.65 Min → Intesa Sanpaolo - Ferrari: 0.32
Conclusions
The analysis was carried out on a portfolio in which the underlyings are weighted equally at 20% and are part of the same equity index. Although there is partial diversification at sector level, it can be seen that such a portfolio, entirely in equities, presents a very high level of risk against a return over 10 years that in this case rewarded the risk taken. The ESG profile of such a portfolio is at an intermediate level and the correlation of securities is rather high.