Performance comparison of different asset classes
This article examines the performance of different asset classes over the past 10 years: equities, government bonds, corporate bonds, gold
Wednesday, 16 March 2022

How much would I have made in 10 years investing € 10000 on an equally-weighted portfolio consisting of the major asset classes?
Let’s see with this analysis carried out on the following instruments:
- Equity: 25%
- Government bond: 25%
- Corporate bond: 25%.
- Gold: 25%
Investment simulation over the last 10 years –> PIC Simulator
From the following table we can see that the maximum drawdown of the portfolio corresponds to the Covid-19 period, with the minimum of -17.84% reached on 18-03-2020. The final value after 10 years has almost doubled, with a performance of around 90%.
| Total Amount Invested | Final Portfolio Value | Profit | Volatility | Annualised Return | Maximum Drawdown |
|---|---|---|---|---|---|
| 10000€ | 18885.54€ | 88.86% | 7.1% | 6.2% | -17.84% in data 2020-03-18 |
Percentage performance comparison –> Comparator
The comparison analysis shows how predictably over a 10-year period the equity component outperforms the other asset classes with the obvious disadvantage of higher volatility and higher drawdowns.
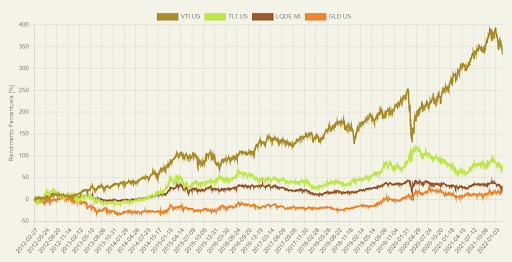
| Asset | Performance (10 years) |
|---|---|
| US Equity ETF | 331.27% |
| US 20-Year Government Bond ETF | 76.16% |
| US Corporate Bond ETF | 28.82%. |
| Gold ETF | 19.3% |
Related guides
Unraveling the Secrets: Key Indicators of an Overvalued Stock Market
Is the stock market overvalued or undervalued? It's a question that lingers in the minds of investors and financial …
Fundamental Analysis vs Technical Analysis: What are the Main Differences?
When it comes to investing, there are two main approaches to analyzing stocks and other financial assets: fundamental …
How interest rate developments influence the credit market
Interest rate developments are a key factor influencing all financial markets, including the credit and 'distressed …